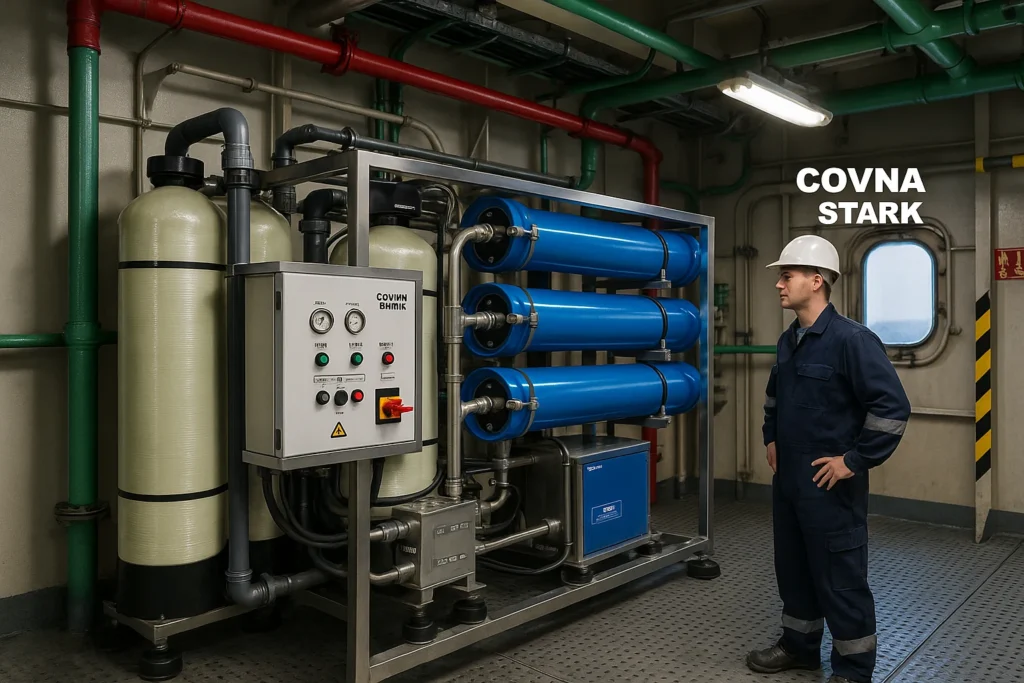
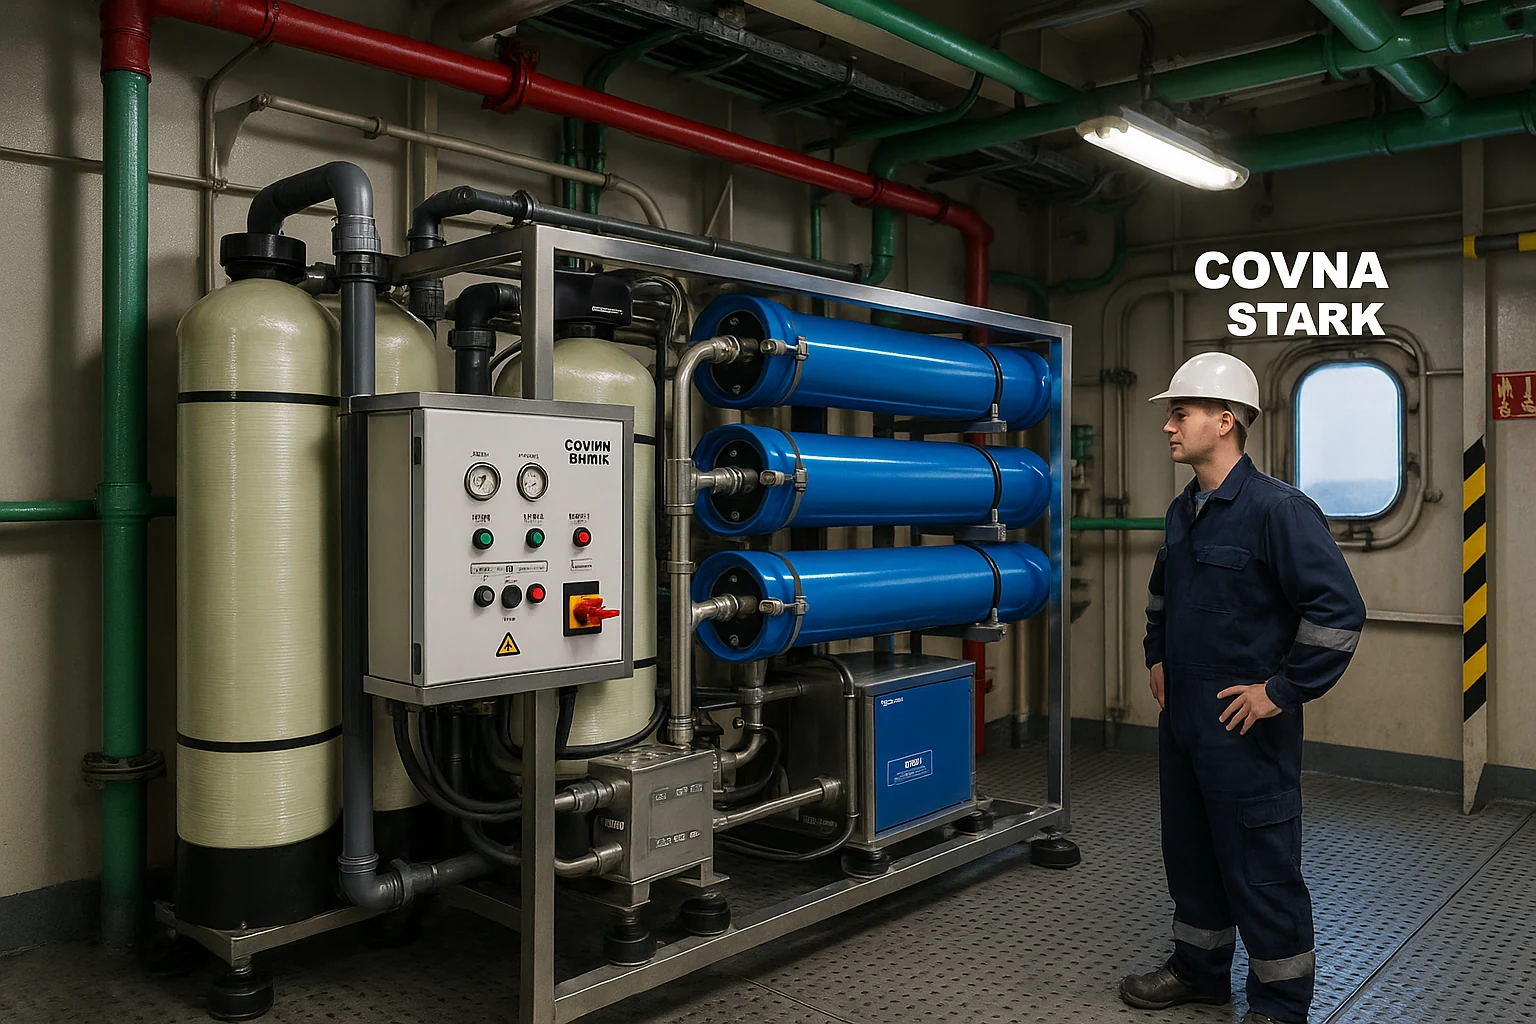
Modern vessels increasingly choose a 逆浸透膜船 solution to produce reliable freshwater with lower energy, faster start/stop, and a compact footprint compared with thermal evaporators. This guide distills engineering practices we use in marine RO projects—from process design and sizing to OPEX maths, maintenance, and acceptance—so you can make purchase decisions with confidence.
Reverse Osmosis Ship — Operating Window & Energy Math
RO separates salts through a semi-permeable membrane at high pressure; there is no phase change or boiler load. For many cargo, OSV, trawler, ferry/Ro-Ro, patrol, and expedition vessels, RO can replace the evaporator entirely or provide N+1 redundancy.

| Aspect | Evaporator | Shipboard RO |
|---|---|---|
| Energy & engine-room heat | High; depends on waste heat | 3.5~5.5 kWh/m³ typical net specific energy |
| Start/stop | Slow, thermal inertia | Fast (minutes), flexible duty |
| フットプリント | Larger, ancillaries | Compact skid; modular trains |
| Maintenance | Descaling, boiling-out | Cartridge filters, antiscalant, periodic CIP |
| Water quality control | Limited real-time control | Continuous conductivity & ΔP monitoring |
Process & P&ID—How Shipboard RO Works
The standard train is: seawater intake → pre-filtration → HP pump → RO membranes → permeate tank → remineralization/disinfection → distribution. Online sensors track conductivity, temperature, flow and differential pressure (ΔP). Auto-flush minimizes fouling after shutdown; lay-up preserves membranes during off-season.

Sizing for Crew, Route & Duty Cycle
Start from daily consumption per person and add hotel/galley load and a safety reserve. Use parallel skids (N+1) where uptime is critical or intake quality varies.
- Daily consumption: 80–120 L/person/day (crew + hotel)
- Reserve: 15–30% for weather/port stays
- Temperature derating: colder seawater lowers permeate flow at a fixed pressure
Worked example — 30 crew, mixed routes
Base need: 30 × 100 = 3,000 L/day. Add 25% reserve ⇒ 3,750 L/day ≈ 3.8 m³/day. Select a 5–10 m³/d unit to allow derating in winter and provide margin for maintenance windows.
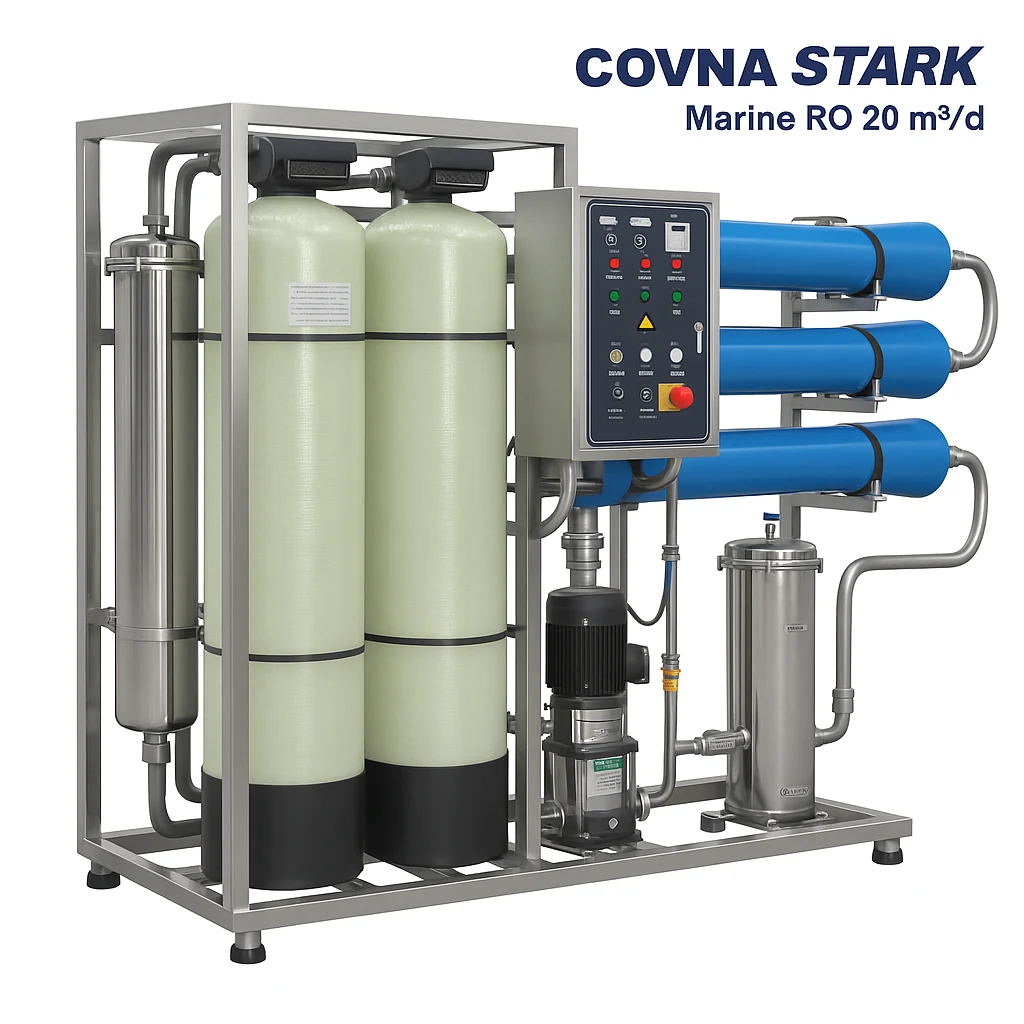
Prefer a ready-to-install option? See our product page: Marine RO 20 m³/d.
Operating Window & Energy Math
Use the following rule-of-thumb for permeate-side specific energy (ignoring minor losses); validate final numbers with your pump curve and ERD selection.
E (kWh/m³) ≈ 0.0278 × ΔPeff (bar) ÷ (ηpump × R)
ΔPeff = discharge pressure minus suction; ηpump = pump efficiency (0–1); R = recovery (permeate/feed).

| パラメータ | Typical range (SWRO) | What to watch |
|---|---|---|
| Feed TDS & temp | 25–40 g/L @ 5–30 °C | Cold water lowers flux; adjust recovery & pressure |
| Recovery (R) | 30–45% | Too high → scaling/ΔP rise |
| Net ΔP | 55–70 bar (SW) | Track pump kW and stage ΔP; fouling increases E |
| ERD (if used) | η 0.8–0.95 | Couple LE elements with an efficient ERD |
Marine-Grade Materials & Protection
- Wetted parts: 316L standard; duplex 2205/2507 for harsher routes and warm, saline water
- Pressure vessels: SWRO 8040/4040 with marine-grade clamps and supports
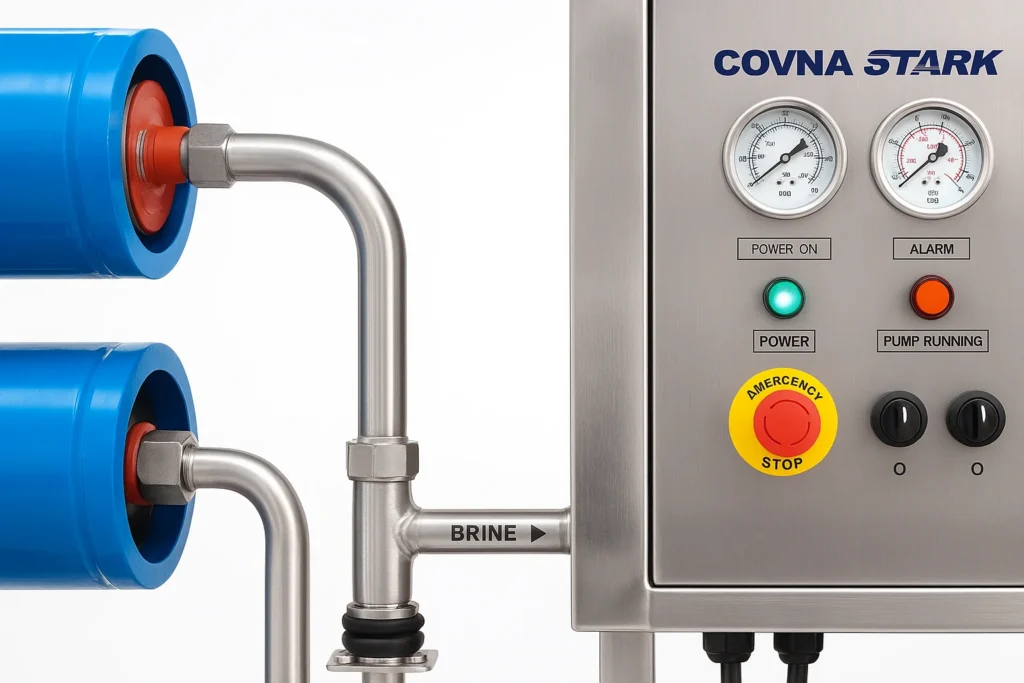
- Electrical: IP54/55 enclosure, cable glands, E-stop, alarms and event logs
- Anti-vibration: mounts under skid; flexible couplings at pump nozzles
- Coatings: epoxy/PU marine coating on frames where applicable
- Labelled interfaces: Seawater / Brine / Permeate / CIP for safe operation
Related components:
Typical BOM & Options
| Module | スタンダード | オプション |
|---|---|---|
| Prefiltration | 5 µm cartridge guard filter | MMF/UF, automatic strainers |
| HPポンプ | SS316 pump, fixed speed | Duplex materials, VFD, energy-recovery device |
| Membranes | 8040 SWRO (LE/HR) | 4040 format for small skids |
| コントロール | PLC + HMI, auto flush | Remote monitoring, data logging, lay-up auto-routine |
| Post-treatment | Remineralization, UV | Chlorination, carbon polish for taste |
Maintenance, CIP & Spare Strategy
- Routine: cartridge change, antiscalant dosing check, ΔP trending, conductivity tracking
- CIP triggers: rising ΔP, declining permeate flow, increased conductivity at constant setpoints
- Typical cadence: CIP every 3–6 months depending on intake and duty; membrane life 3–5 years
- Spare kit: cartridges, O-rings, pump service kit, antiscalant, preservation chemicals
Troubleshooting at Sea
| Symptom | Likely causes | Actions |
|---|---|---|
| ΔP rising fast | Fouling/scaling, clogged cartridge | Replace cartridge, check SDI & antiscalant; schedule CIP |
| Permeate flow drops | Cold water, fouling, pump issue | Adjust setpoints, verify pump curve, CIP if ΔP high |
| Conductivity spikes | Seal leak, O-ring damage, bypass | Inspect vessels & seals, pressure test, swap O-rings |
| Frequent shutdown alarms | Intake swings, sensor drift | Stabilize intake, recalibrate sensors, review alarm limits |
Case Snapshot—OSV Retrofit (20 m³/d)
An offshore support vessel replaced a thermal evaporator with a 20 m³/d RO skid. After commissioning, logs showed a ~18% reduction in kWh/m³ versus baseline and improved water quality stability. The operator adopted a ΔP-based CIP trigger and quarterly cartridge changes, reducing unplanned maintenance.
Potable-Water Safety & Records
Re-mineralization and disinfection (UV/chlorination) are standard. Keep commissioning records and test logs with your class documentation. Reference potable-water limits using recognized guidance such as the WHO drinking-water guidelines.
Procurement & Acceptance Checklist (Download)
Use this checklist for RFP, FAT/SAT and handover. Download the editable Excel and attach it to your vessel’s CMMS: Marine RO Acceptance Checklist (XLSX)
Need an implementation-ready unit? See: COVNA STARK Marine RO 20 m³/d.
Payback & Energy Savings Model
Energy dominates OPEX for seawater RO. Use this quick comparison to estimate annual savings against a thermal evaporator. Validate with your pump curve, ERD selection and local energy prices before purchase decisions.
| 項目 | Symbol | Example |
|---|---|---|
| Daily permeate | Q | 20m³/日 |
| Specific energy (RO) | E_ro | 4.5 kWh/m³ |
| Specific energy (evaporator) | E_evap | 8–12 kWh/m³ (equivalent) |
| Energy price | C_e | 0.16 USD/kWh |
| Annual operation | h | 330 days × 24 h |
Annual energy cost (RO) ≈ Q × E_ro × C_e × 24 × 330
= 20 × 4.5 × 0.16 × 7920 ≈ $11,404
Annual energy cost (Evaporator) (with 9 kWh/m³ equiv.) ≈ $22,809
Indicative annual saving ≈ $11,400. Higher ERD efficiency or VFD optimization can further improve savings.
Note: This is an engineering approximation. It ignores potable water quality differences, boiler efficiency and auxiliary loads. Use detailed sizing for procurement decisions.
FAT & SAT Acceptance Steps
- Documentation check: GA, P&ID, IOM, nozzle list, nameplate parameters, material declarations.
- Cold test: PLC/HMI I/O, alarms and interlocks; auto-flush and lay-up routines verified.
- Hydro test: Pressurize to 1.1–1.3× rated pressure; check for leaks and abnormal differential pressure.
- Performance test: Record feed/permeate flows, conductivity, pump power, recovery and specific energy.
- SAT onboard: Connect to seawater intake/brine/permeate; verify vibration mounts, noise level and ship power compatibility.
- Handover: Deliver spares list, maintenance plan, CIP recipes and commissioning logs; train crew.
Download the editable checklist (XLSX) and attach it to your CMMS: Marine RO Acceptance Checklist
よくあるご質問
- What capacity do I need for a 20–40 crew vessel?
- Plan for 80–120 L/person/day plus 15–30% reserve. Use N+1 trains where uptime is critical.
- Can a reverse osmosis ship system fully replace an evaporator?
- Yes for most routes. RO delivers lower energy and faster start/stop; keep backup capacity for CIP windows.
- How often should we run CIP at sea?
- Every 3–6 months in typical service; trigger earlier with ΔP and SDI trends.
- Which materials are recommended for corrosion resistance?
- 316L is the baseline; choose duplex 2205/2507 for harsher, warmer and more saline conditions.
- How should we lay up the unit during off-season?
- Flush, preserve with approved chemicals, protect from freezing; follow the IOM precisely.
Author: STARK Water Engineering Team · Updated: 2025-09-17

