


Reading time: 12–16 minutes · Audience: RO designers, operators, process engineers, EPCs
Feedwater temperature RO System is one of the most important but underrated parameters in reverse osmosis design and operation. Temperature quietly changes viscosity, diffusion and reaction rates, so the same plant can behave like a completely different system in winter versus summer.
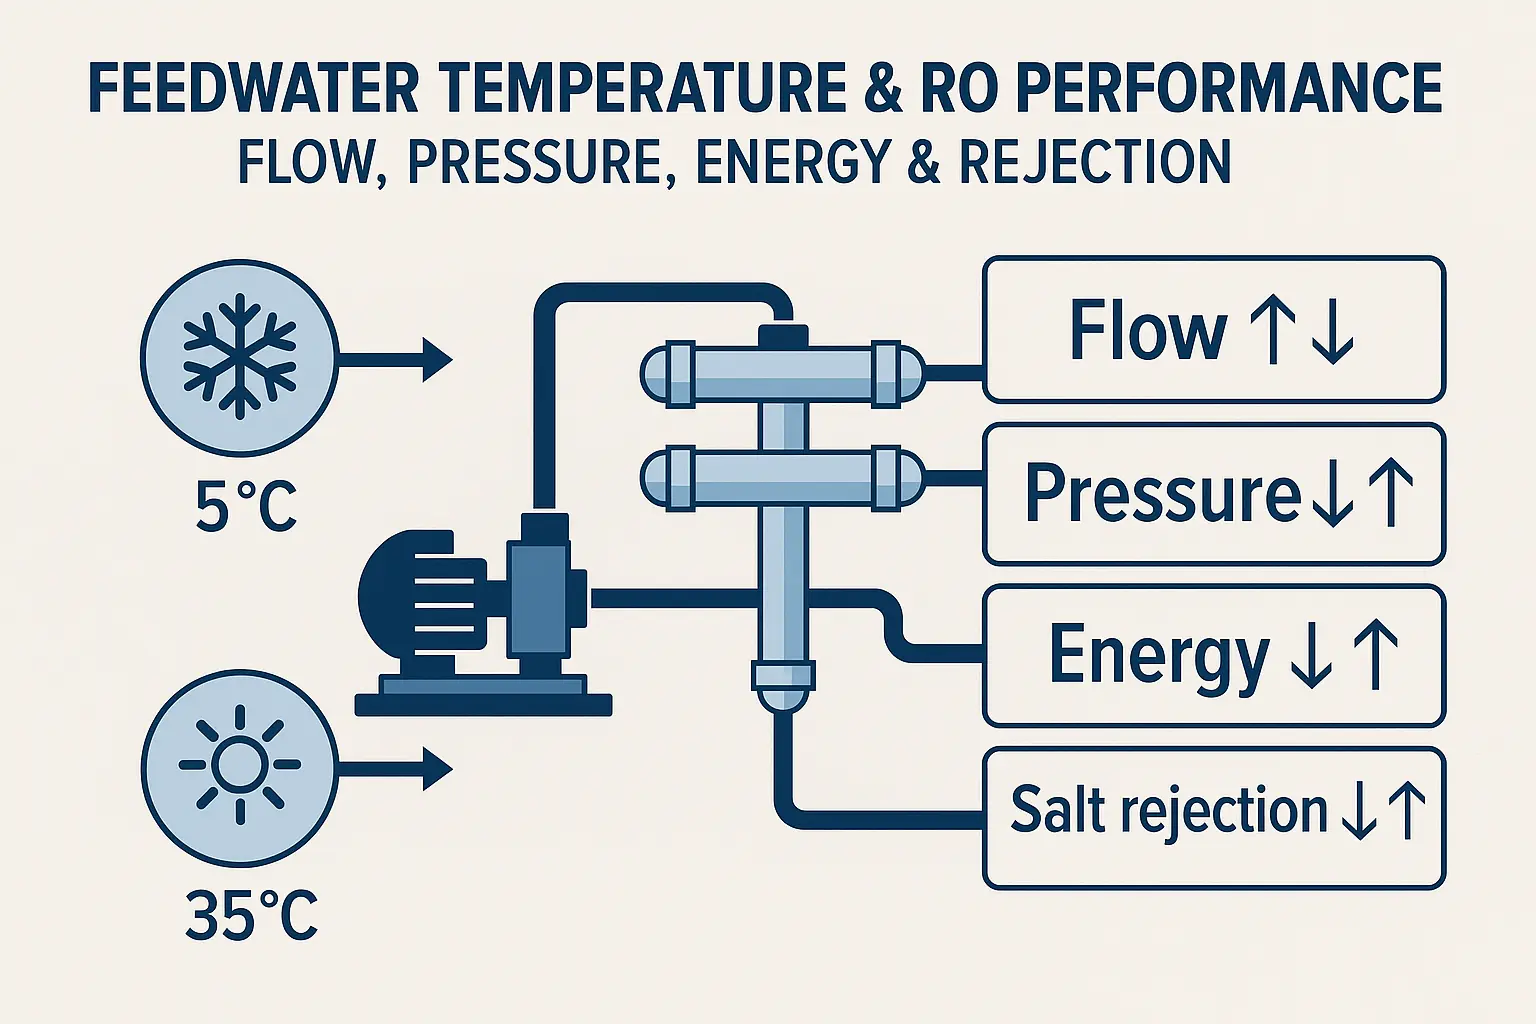
Executive summary: Higher feedwater temperature boosts permeate flow and lowers required pressure, but it reduces salt rejection and accelerates chemical and biological damage to membranes. Colder water does the opposite: it protects membranes and salt rejection but punishes energy consumption and can change scaling behaviour. This guide explains the mechanisms, gives practical rules of thumb, and shows how to build temperature into RO design, monitoring and seasonal operating plans.

Feedwater Temperature RO System — A Double-Edged Sword for RO System Performance
In any feedwater temperature RO System discussion, temperature affects almost every aspect of RO System performance:
- Permeate flow: warmer water is less viscous and passes through the membrane more easily.
- Required pressure and energy: cold water needs higher pressure (and therefore more energy) to maintain the same production rate.
- Salt rejection and permeate quality: higher temperature increases ion diffusion and salt passage, lowering rejection.
- Membrane life and fouling risks: high temperature speeds up oxidation and biofouling; extreme low temperature risks freezing and mechanical damage.
The challenge is to design and operate the plant so that these temperature effects are controlled and visible rather than hidden in the data.
Temperature vs Permeate Flow — The 2.5–3% per °C Rule
The most visible impact of feedwater temperature RO System behaviour is on permeate flow. As water warms up, viscosity decreases and water molecules move more easily through the membrane pores. For typical thin-film composite RO membranes, a good rule of thumb is:
Permeate flow changes by approximately 2.5–3.0% per °C relative to the design point at 25 °C.
In practice, that means:
- Going from 25 °C down to 10 °C can reduce permeate flow by roughly 35–45% if pressure is not increased.
- Going from 25 °C up to 35 °C can increase flow by roughly 25–30% at the same pressure.
To avoid chasing temperature, most plants use normalized permeate flow. This calculation corrects the actual flow back to a reference temperature (commonly 25 °C) using the membrane manufacturer’s temperature correction factor (TCF). Fouling trends are then visible even when seasons change.
Temperature vs Operating Pressure and Energy
Because colder feedwater is more viscous, RO systems must run at higher feed pressure to deliver the same permeate rate. A simplified example for a plant designed at 25 °C:
| Feedwater temperature | Typical feed pressure to produce 100 m³/h | Relative specific energy |
|---|---|---|
| 5 °C | ≈ 13 bar | High (≈30–40% more than at 25 °C) |
| 25 °C (design) | ≈ 10 bar | Baseline |
| 35 °C | ≈ 8 bar | Lower (energy savings possible) |
In colder climates, winter electricity consumption can easily be 30% or more higher than summer for the same permeate production, simply because the pumps must work against higher pressure. This is where variable-frequency drives (VFDs) and optimized setpoints pay off: the high-pressure pump can track the needed pressure as temperature drifts instead of running at a fixed, inefficient operating point.
Temperature vs Salt Rejection and Product Quality
Salt rejection is also temperature dependent. At higher temperatures, ions diffuse faster through the membrane and salt passage increases faster than water flux. The result is a gradual decrease in salt rejection as temperature rises.
Typical observations:
- Between 10–15 °C and 25 °C, rejection is usually strongest.
- From 25 °C up to 35 °C, salt passage can increase enough to noticeably lower permeate resistivity or increase conductivity.
Industries with tight water quality requirements feel this first:
- Electronics / UPW: small changes in rejection can push resistivity below 15–18 MΩ·cm in summer unless polishing steps (EDI, mixed-beds) are sized with margin.
- Pharmaceutical and biotech: more ionic load hits downstream polishing and disinfection, increasing operating cost and validation risk.
When warm-season permeate consistently fails quality targets, options include tightening membranes, adding or upgrading polishing steps, or lowering recovery so that element flux is less aggressive at high temperature.
Temperature Impacts on Membrane Life and Fouling Risks
High-Temperature Risks (> 30 °C)
- Chemical degradation: Polyamide RO membranes are sensitive to oxidants such as free chlorine and ozone. Higher temperature accelerates these reactions, so a membrane exposed to the same ppm·h of oxidant will suffer damage much faster at 35 °C than at 20–25 °C.
- Biofouling: Microbial growth rates are highest in the 25–35 °C range. Warm feedwater encourages biofilm formation in pretreatment filters, distribution piping and the RO itself unless biocide programs and sanitation are well controlled.
- Hydraulic stress: Operators sometimes keep pressure constant in summer and accept the extra flux. Over-fluxing lead elements at high temperature accelerates compaction and fouling.
Low-Temperature Risks (< 10 °C)
- Scaling behaviour: Some salts (e.g., calcium carbonate) become more soluble at lower temperature, but the higher pressure used to recover flow can increase concentration polarization at the membrane surface and aggravate other scalants, such as calcium sulfate or silica.
- Mechanical damage: In outdoor or poorly insulated installations, residual water inside housings can freeze during shutdowns and physically damage membranes, O-rings or pressure vessels.
- Viscosity-driven fouling: Thicker, colder water can make existing fouling look worse in terms of pressure drop; without normalization, it is easy to misinterpret seasonal changes as sudden plugging.
Design Considerations for Seasonal Temperature Swings
Good RO design uses the lowest expected feedwater temperature as the basis for pump sizing and membrane selection.
- Pump head and motor power: size for the coldest credible feedwater, including fouling margin, so that you can still meet permeate production in winter without overloading the motor.
- Membrane selection and loading: choose elements and number of elements per vessel so that flux is acceptable at both low and high temperature; use design software to check worst-case conditions.
- VFDs on high-pressure pumps: VFDs allow you to reduce pressure and energy consumption in warm seasons while still having enough headroom at low temperature.
- Equipment ratings: ensure pressure vessels, piping, seals and instruments are rated for the full temperature range, including CIP temperatures.
- CIP and thermal control: in extreme climates, heaters, insulation or chillers may be justified to keep the RO within a safe operating band.
Operating Strategies by Season
Winter Playbook — Cold Feedwater
- Use normalized flow to distinguish real fouling from simple temperature effects.
- Increase feed pressure cautiously to restore permeate flow; watch recovery and scaling limits, adjusting antiscalant dosing if necessary.
- Consider temporarily lowering recovery setpoints during the coldest weeks to stay safely below scaling saturation at higher pressure.
- Watch for increased ΔP across pretreatment filters; cold water can make existing plugging more apparent.
Summer Playbook — Warm Feedwater
- Take advantage of lower viscosity by reducing feed pressure with the VFD to save energy while keeping flux within design limits.
- Tighten quality alarms: monitor permeate conductivity or resistivity, especially at the hottest times of day.
- Review dechlorination and biofouling control strategies; verify that residual oxidants are controlled and that any biocide program is compatible with the membranes.
- Ensure CIP frequency and chemistry are appropriate for the higher biofouling tendency at warm temperature.
Monitoring & Normalization — Keeping Temperature From Hiding Problems
Without normalization, raw flow and conductivity data can be misleading. A plant might appear to “recover” in spring even though fouling is still increasing, simply because the water warmed up.
Best practice is to create temperature-corrected KPIs:
- Normalized permeate flow: correct actual flow to 25 °C using the manufacturer’s TCF.
- Normalized salt passage or rejection: account for temperature when trending permeate conductivity and feed/concentrate conductivity.
- Normalized pressure drop: in some cases, particularly high-pressure brackish or seawater systems, ΔP normalization helps distinguish viscosity effects from real plugging.
A simple RO log sheet can include columns for actual temperature, TCF, normalized flow, normalized rejection and normalized ΔP. Plotting these over time makes fouling, scaling and operational changes much easier to interpret and turns feedwater temperature RO from a hidden disturbance into a controlled design parameter.
Practical Example — Same RO at 5 °C, 25 °C and 35 °C
Consider a brackish-water RO plant designed to produce 100 m³/h at 25 °C and 10 bar feed pressure:
| Temperature | Feed pressure (approx.) | Permeate flow (if pressure fixed at 10 bar) | Key notes |
|---|---|---|---|
| 5 °C | 13 bar to hold 100 m³/h | ≈ 60–65 m³/h at 10 bar | Energy consumption high; cold water masks some fouling; scaling risk must be checked. |
| 25 °C | 10 bar | 100 m³/h | Design point; baseline KPIs and normalized values equal actual values. |
| 35 °C | 8 bar for 100 m³/h | ≈ 125–130 m³/h at 10 bar | Energy savings possible, but salt rejection decreases and over-fluxing risk is high. |
This simple comparison shows why “same plant, different season” can feel like different equipment. Only by correcting to a common temperature can you see the underlying health of the membranes.
FAQ — Quick Answers That Rank
How much does RO permeate flow change with temperature?
A common rule of thumb is that permeate flow changes by about 2.5–3.0% per °C relative to the design point at 25 °C. Always refer to the membrane manufacturer’s temperature correction factor for precise calculations.
Why does RO salt rejection drop in summer?
Higher temperature increases ion diffusion through the membrane faster than it increases water flux. Salt passage rises, so the apparent salt rejection decreases and permeate conductivity tends to increase.
What feedwater temperature is ideal for RO?
Many systems operate best in the 20–30 °C range, where there is a reasonable balance between permeate flow, salt rejection, energy consumption and membrane life. Outside this range you can still run successfully, but extra design and operating care are required.
Can I simply heat cold feedwater to fix winter performance?
Heating can help when energy is inexpensive and temperature extremes are moderate, but it adds complexity and cost. In many plants it is more economical to combine moderate heating with higher pressure, temporary recovery reduction and robust antiscalant control.
Further Reading & Related Tools
- 산업용 수처리 솔루션
- RO and UF Case Studies
- Stark Water Tools — Online Calculators
- More RO Design and Troubleshooting Guides
- Further Reading & Related Tools
- 산업용 수처리 솔루션
- RO and UF Case Studies
- Stark Water Tools — Online Calculators
- More RO Design and Troubleshooting Guides
- Reverse osmosis — general overview
- RO membrane performance and temperature — manufacturer guidance
Next Steps
If you want to redesign or audit your plant with feedwater temperature RO properly built into the model, we can help. Share your seasonal temperature data, operating logs and membrane type, and we will map out a temperature-aware RO strategy for you.
견적 요청하기 to start a temperature-aware RO design review.