
Резюме
This 1000 LPH RO OPEX calculator helps you estimate monthly cost based on real operating assumptions—energy, chemicals, cartridges, CIP and membrane amortization.At the 1000 LPH scale, RO OPEX is dominated by energy, chemicals (antiscalant, dechlorination, pH control/CIP), cartridge filters, CIP frequency и membrane amortization. With correct pretreatment (SDI ≤ 3) and realistic recovery (55–70%), many small plants run 3–6 months between CIPs and keep cost per m³ stable. If you are scoping a configured package, see our reference: 1000 LPH RO Water Treatment Solution
What OPEX includes (monthly view)
- Энергия – kWh/m³ × monthly permeate × electricity tariff.
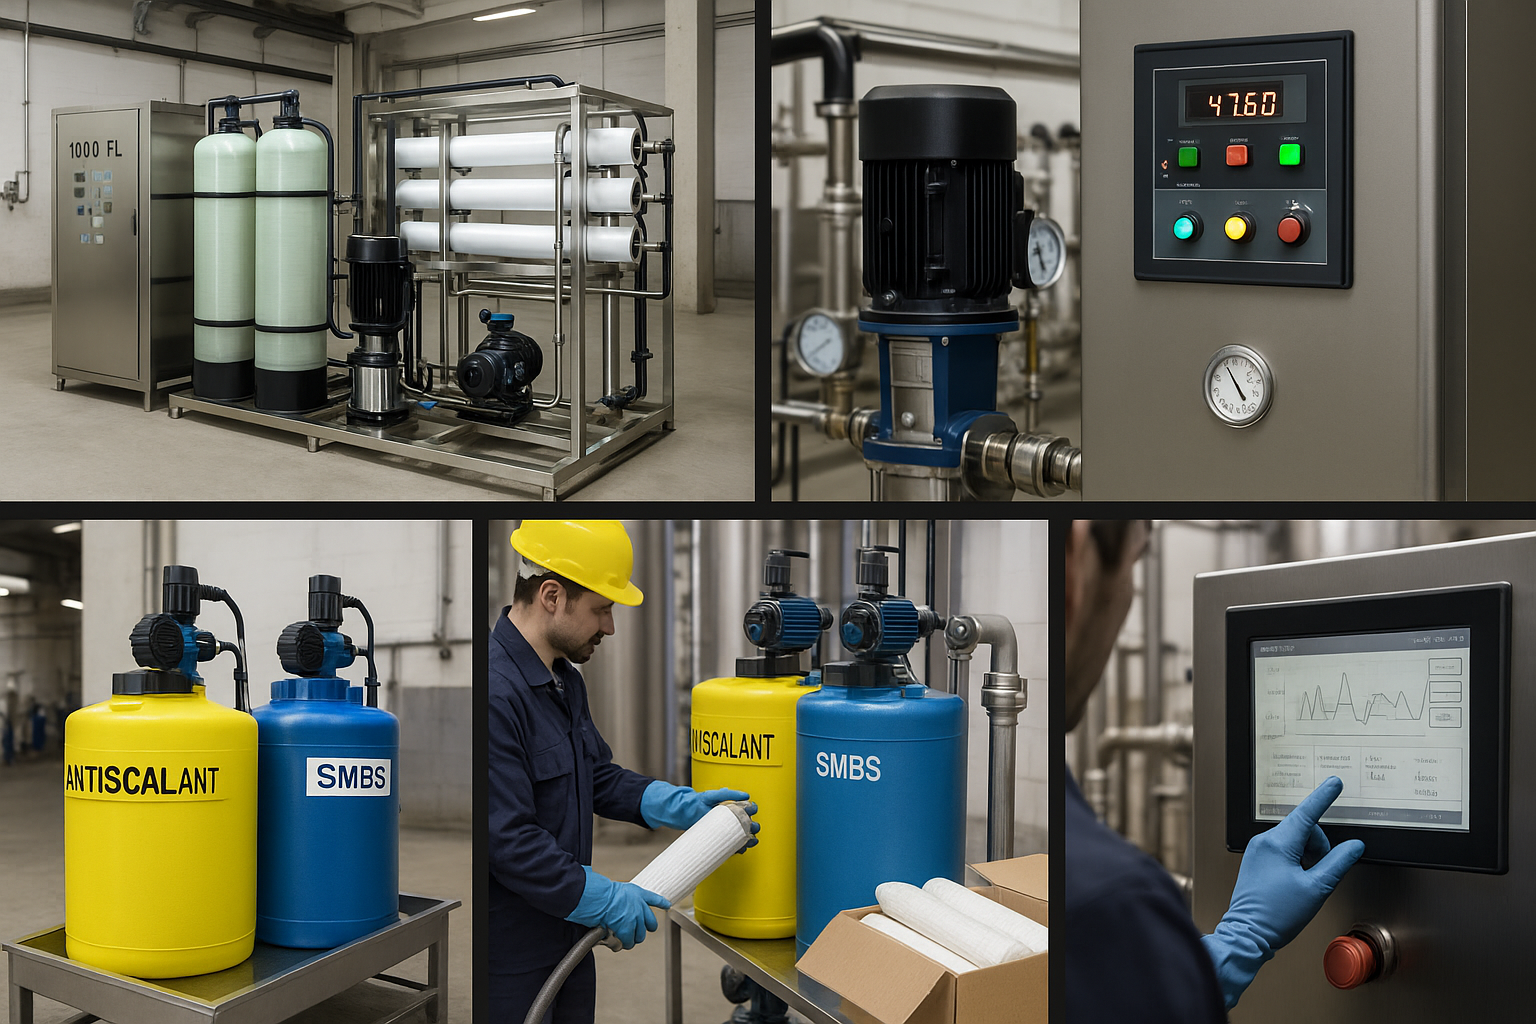
- Chemicals – antiscalant (and, if used, SMBS for dechlorination, acid/alkali for pH), converted from dose (mg/L) to kg.
- Cartridge filters – quantity × unit cost.
- CIP – #CIPs per month × (chemicals + labor/downtime).
- Membrane amortization – membrane set price ÷ lifetime (months).
- Дополнительно – operator labor, water make-up/discharge cost, spares & service.
 1")
Typical 1000 LPH brackish RO planning numbers (site-dependent): 0.7–1.2 kWh/m³ @ 8–16 bar; antiscalant 2–5 mg/L; SMBS 0–3 mg/L (only if free chlorine present); cartridge 2–6 pcs/month; CIP 0.2–0.5 /month on stable pretreatment.
The 1000 LPH RO OPEX calculator groups all items into a transparent monthly view.
 2")
Inputs you need
- Permeate flow (LPH), hours/day, days/month → monthly m³.
- Energy intensity (kWh/m³) and electricity tariff ($/kWh).
- Chemical doses (mg/L) and prices ($/kg).
- Cartridge filters per month and unit price.
- CIP frequency and per-CIP cost (chemicals + labor/downtime).
- Membrane set price and expected lifetime (months).
With these inputs, the 1000 LPH RO OPEX calculator stays fully editable to your site.
 3")
1000 LPH RO OPEX calculator: live tool and assumptions
Калькулятор OPEX для обратного осмоса 1000 л.с.
How to reduce OPEX (without hurting reliability)
- Guard SDI ≤ 3 before RO; it stabilizes flux and lengthens CIP intervals.
- Tune recovery on trend data (ΔP, conductivity, normalized flux)—chasing very high recovery often costs more energy and chemistry.
- Seasonal set-points—colder water needs more pressure; pre-plan winter vs summer curves.
- VFD & pump efficiency—operating close to BEP reduces kWh/m³ and vibration.
- Chemistry control—dose for real load (Fe/Mn, carbonate scaling index), not “fixed numbers”.
- Filter procurement—bulk purchase cartridges; monitor differential pressure to avoid premature changes.
Use trend data to update the 1000 LPH RO OPEX calculator every season.For energy price references, see the
U.S. EIA electricity statistics,
and for water-quality principles see the
WHO Guidelines for Drinking-water Quality.
 4")
Worked example
For 1000 LPH, 10 h/day, 26 days/month → ~260 m³/month. Energy @ 1.0 kWh/m³ and $0.12/kWh → 260 kWh = $31.2. Antiscalant at 3 mg/L and $4/kg → 0.78 kg = $3.12. SMBS at 1 mg/L and $2/kg (only if free chlorine present) → 0.26 kg = $0.52. Cartridge filters: 4 pcs × $12 = $48. CIP: 0.25 per month × ($60 chemicals + $40 labor) = $25. Membranes: $600 ÷ 24 months = $25. Total ≈ $132 per month, ≈ $0.51 per m³. Your market prices for electricity and chemicals will shift the result the most.
Practical tips
Guard SDI ≤ 3 to stabilize flux and extend CIP intervals. Tune recovery on trend data instead of chasing a static number. Use seasonal set-points (winter vs summer). Run the pump close to BEP with a VFD. Dose chemicals to actual load (Fe/Mn, scaling index). Bulk-purchase cartridges and change on ΔP, not on calendar.
ЧАСТО ЗАДАВАЕМЫЕ ВОПРОСЫ
Q1. What is a good energy target for 1000 LPH brackish RO?
Plan 0.7–1.2 kWh/m³ at 8–16 bar—temperature, recovery and pretreatment quality shift it.
Q2. How often should we CIP?
Trigger on ΔP +15–20%, permeate conductivity drift or normalized flux loss. With stable pretreatment, many plants run 3–6 months between CIPs.
Q3. Does UF always make sense?
Use UF when SDI > 3 or turbidity is spiky/seasonal; it stabilizes flux and often lowers total OPEX over 2–3 years.