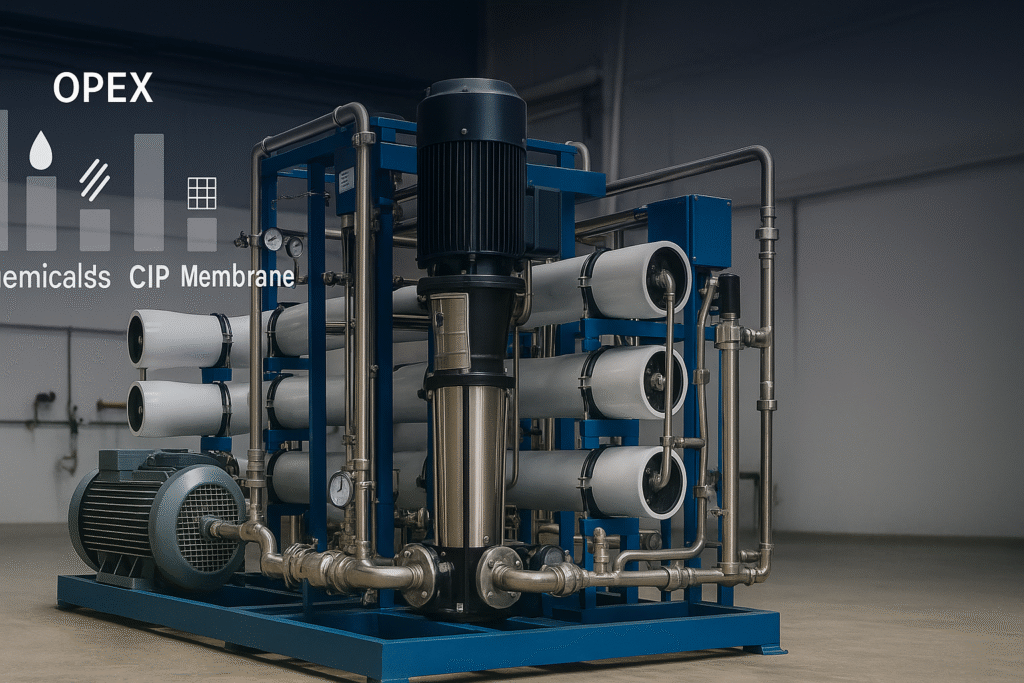
What this RO OPEX calculator includes (monthly view)
This RO OPEX calculator estimates the operating cost of a small to mid-scale reverse osmosis skid on a month-by-month basis. It breaks OPEX into six parts: energy, chemicals (antiscalant and—if applicable—SMBS for dechlorination, acid/alkali for pH control and CIP), cartridge filters, CIP frequency (chemicals + labor/downtime), membrane amortization, and a catch-all “other” line. Results help you benchmark cost per m3 and identify the biggest levers to optimize.
How to use the RO OPEX calculator
- Define production: set Permeate flow (LPH), hours/day dan days/month. The tool converts to monthly m³.
- Enter energy intensity (kWh/m³) dan local tariff. For brackish RO, realistic ranges are ~0.7–1.2 kWh/m³ at 8–16 bar (site-dependent).
- Chemicals: use typical antiscalant dose (e.g., 2–5 mg/L) and local $/kg. If you dechlorinate, add SMBS dose and price. If you regulate pH or CIP chemistry, include those in the CIP cost lines.
- Cartridge filters: enter the number of filters consumed per month and the unit price. Pretreatment quality and SDI drive this number.
- CIP frequency: enter average CIPs/month, plus chemical cost and labor/downtime cost per CIP. Well-designed brackish systems often run 3–6 months between CIPs.
- Membrane amortization: set the membrane set price and expected lifetime (months). The calculator spreads the cost across the lifetime.
Interpreting results & typical ranges
- Energy usually dominates at small scale. Improving pump/VFD efficiency and realistic recovery targets have outsized impact.
- Chemicals grow with higher recovery and challenging feed (TDS/SDI/temperature). Proper antiscalant selection and dosing control reduce waste.
- Filters are a proxy for pretreatment performance. If filters spike, review SDI trending, MMF/UF condition, and upset protection.
- CIP frequency is the tell: rising CIP cadence indicates a recovery target or pretreatment issue and pushes up OPEX and downtime.
- Membrane amortization falls with longer life; good pretreatment and conservative operating windows lower lifecycle cost.
Worked example (1000 LPH brackish RO)
Assume 1000 LPH, 10 h/day, 26 days/month ⇒ 260 m³/month; energy 1.0 kWh/m³ at $0.11/kWh; antiscalant 3 mg/L at $4/kg; four 30″ cartridges/month at $12/pc; CIP every 4 months (0.25/month) with $60 chemicals and $40 labor; membrane set (2×4040) $600 with 24-month life. The calculator yields a total OPEX on the order shown in the table above and a cost per m³ in the $0.4–0.7 range under stable pretreatment. Your site values will vary.
Ways to reduce OPEX without hurting reliability
- Target a realistic recovery for your TDS/temperature/SDI; pushing recovery too high increases scaling risk and CIP frequency.
- Stabilize with UF or better pretreatment when SDI > 3 or turbidity is variable; this improves flux stability and filter life.
- Instrument conductivity, pressure and flow online; use trending to detect drift early and schedule maintenance before efficiency losses stack up.
- Use vendor-recommended element operating windows and seasonal set-points to avoid unnecessary pressure/energy penalties.
Related resources
• Reference solution with architecture, KPIs and selection guides:
1000 LPH RO Water Treatment Solution.
• Example hardware starting point:
1000 L Reverse Osmosis System.
• Electricity tariff data (external):
U.S. EIA – Electricity.
• Drinking-water quality guidance (external):
WHO Guidelines for Drinking-water Quality.
FAQ – RO OPEX calculator
What’s included in OPEX here?
Energy, antiscalant and optional SMBS/pH chemicals, cartridge filters, CIPs (chemicals + labor/downtime), membrane amortization and an “other” bucket for site-specific items.
What energy number should I plan for?
For brackish RO, plan roughly 0.7–1.2 kWh/m³ at 8–16 bar. Salinity, temperature and recovery shift this range.
How do I choose antiscalant dose?
Start with vendor software and your target recovery. Typical ranges are 2–5 mg/L for brackish feeds; verify against your ions and operating window.
How often is CIP reasonable?
With solid pretreatment and realistic recovery, many small plants run 3–6 months between CIPs. Rising CIP cadence is a signal to revisit pretreatment or recovery.
Does membrane lifetime affect monthly OPEX a lot?
Yes. Spreading a membrane set over 24–36 months meaningfully lowers $/m³. Proper pretreatment and conservative operation extend life.

