Reading time: 10–14 minutes · Penonton: EDI/RO engineers, UPW designers, EPCs
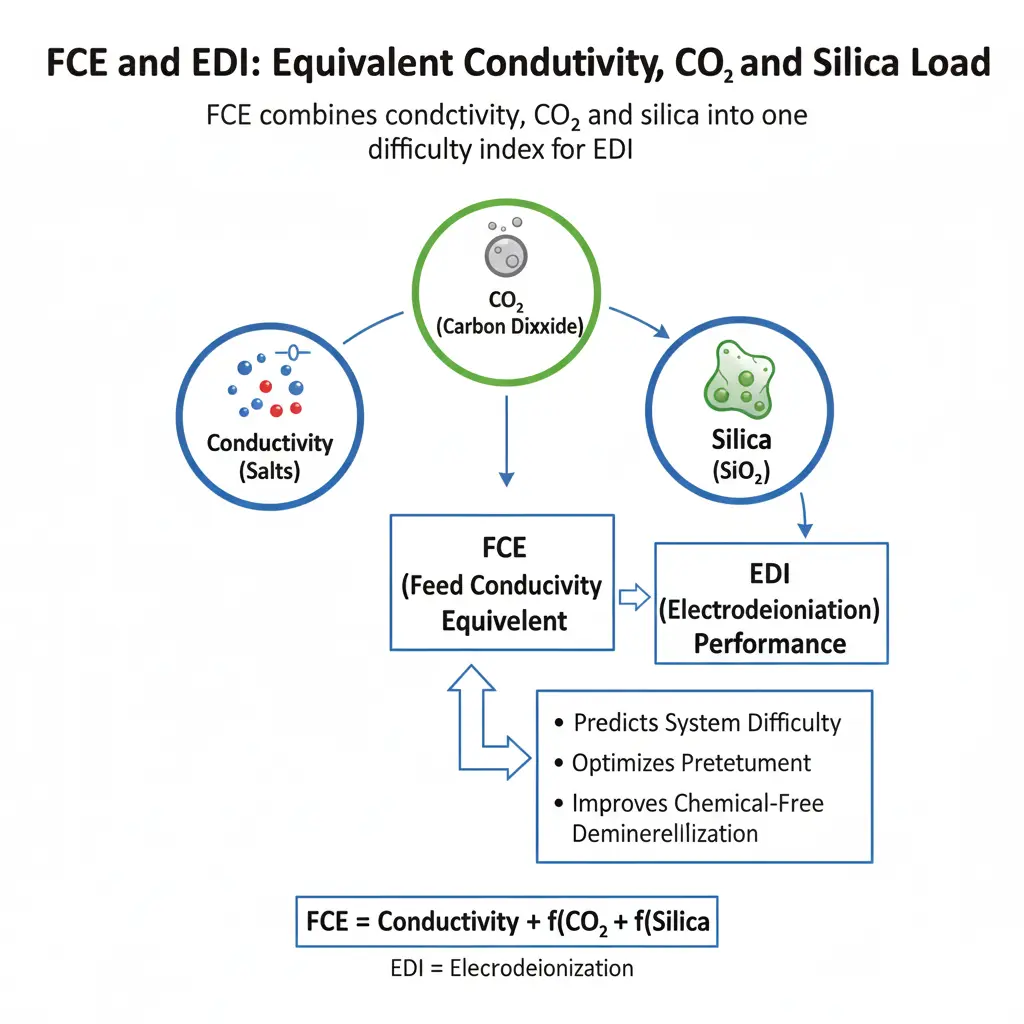
FCE EDI tells you how hard your electrodeionization stack will run by rolling conductivity, CO₂ and silica into one load number.
Executive summary: FCE EDI is the fastest way to predict how difficult your electrodeionization stack will be to run. FCE converts the combined effect of conductivity, dissolved carbon dioxide and silica into a single “load” number. As FCE rises, current efficiency falls, product resistivity drops, and the stack runs hotter.

What Is FCE and Why It Matters
FCE EDI — Definition and Field Use
Engineers use FCE EDI to bridge the gap between meter readings and real stack difficulty. It reflects hidden load from dissolved CO₂ and silica that conductivity alone misses.
FCE (Equivalent Conductivity) is a composite index that converts conductivity + total CO₂ + silica into one figure-of-merit for EDI load. It closes the gap between what a conductivity meter displays and what the EDI stack actually “feels.”
Engineer’s field formula
FCE (µS/cm) = Conductivity (µS/cm) + 2.79 × Total CO₂ (ppm) + 1.94 × SiO₂ (ppm).
- Total CO₂ means CO₂ + HCO₃⁻ + CO₃²⁻ (pH shifts speciation but not the total).
- Worked example: Conductivity 5 µS/cm, Total CO₂ 6 ppm, SiO₂ 1 ppm → FCE = 5 + 2.79×6 + 1.94×1 = 23.7 µS/cm. Planning for “5 µS/cm” would badly underestimate the real EDI burden.
Why CO₂ dominates: CO₂ passes RO while alkalinity largely does not. The carbonate buffer in permeate shifts acidic until degassed, and CO₂/HCO₃⁻ are weakly held on resins—so EDI must remove them or struggle.
How FCE Predicts EDI Product Water
- Higher FCE → higher EDI load: more stack voltage for the same flow and lower product resistivity.
- Conductivity-only specifications underestimate difficulty whenever CO₂ and/or silica are significant.
When teams compare options, the FCE EDI value quickly shows why two feeds with the same conductivity behave differently: one may carry high CO₂ or silica. Designing to the FCE EDI band prevents under-sizing, reduces stack stress, and stabilizes product quality.
Target Windows by Pretreatment Route
| Pretreatment | Typical FCE at EDI Inlet | Catatan |
|---|---|---|
| Two-pass RO (RO-RO) | 1–5 µS/cm | Mild NaOH trim ahead of pass-2 converts CO₂→HCO₃⁻ for higher RO rejection; common for UPW (power/semiconductor). |
| RO + Membrane Degasser (GTM/MDG) | 5–15 µS/cm | Best with inlet pH ≤ 6.1 to enhance CO₂ stripping; useful where feed allows. |
| Single-pass RO | 10–30 µS/cm | Meets many industrial/pharma PW needs; CO₂ often limits performance. |
How to Reduce FCE (Action Playbook)
- Improve RO desalting: upgrade membranes; optimize recovery/temperature; stabilize feed pH.
- pH strategy before pass-2: light NaOH to push CO₂→HCO₃⁻ and reject in RO; watch silica ceilings.
- Membrane degassing (GTM): strip dissolved CO₂; run with degasser-inlet pH ~6.0–6.1 for best mass transfer.
- Silica management: respect monomer/polymer limits and pair with RO settings so FCE targets are achievable.
Measurement & Calculation — Getting Reliable FCE
- Where to sample: stabilized RO permeate and EDI feed. Log conductivity (µS/cm), total CO₂ (ppm) and silica (ppm).
- Spreadsheet tip: flag FCE bands with conditional formatting: <5 (green), 5–15 (amber), >15 (red).
- Why pH is not in the formula: pH shifts carbonate speciation but not total CO₂; the total is what loads EDI.
Using FCE in EDI Design & Operations
- Design: choose stack area/current density based on your FCE band; provide degas capacity if band >10 µS/cm.
- Acceptance criteria: tie product resistivity/TOC and stack ΔV/ΔI trends to FCE.
- Troubleshooting linkage: if salts are steady but product worsens, suspect CO₂ breakthrough, degasser performance or air ingress upstream.
FAQ — Quick Answers That Rank
Is FCE just conductivity?
No. It includes weighted contributions from total CO₂ dan silika, which often dominate the EDI burden even when conductivity is low.
What FCE should I target for ultrapure water?
For UPW via two-pass RO feeding EDI, aim for FCE 1–5 µS/cm at the EDI inlet.
Why does RO permeate pH usually drop?
CO₂ passes through RO while alkalinity largely does not. The carbonate buffer shifts acidic until degassed.
Further Reading
Langkah Selanjutnya
Want us to map your RO/EDI pretreatment to an FCE target band and ROI? Minta Penawaran.

