Reverse osmosis plant cost is primarily driven by six levers: capacity and duty cycle, feed quality (TDS/SDI), pretreatment, materials and automation, energy and chemicals, and maintenance cadence. This guide focuses on 1000 LPH (~1 m³/h) brackish/borewell systems and explains how each lever affects reverse osmosis plant cost, with an OPEX mini-model and a buying checklist.
1)Reverse osmosis plant cost: a practical framework (six levers)
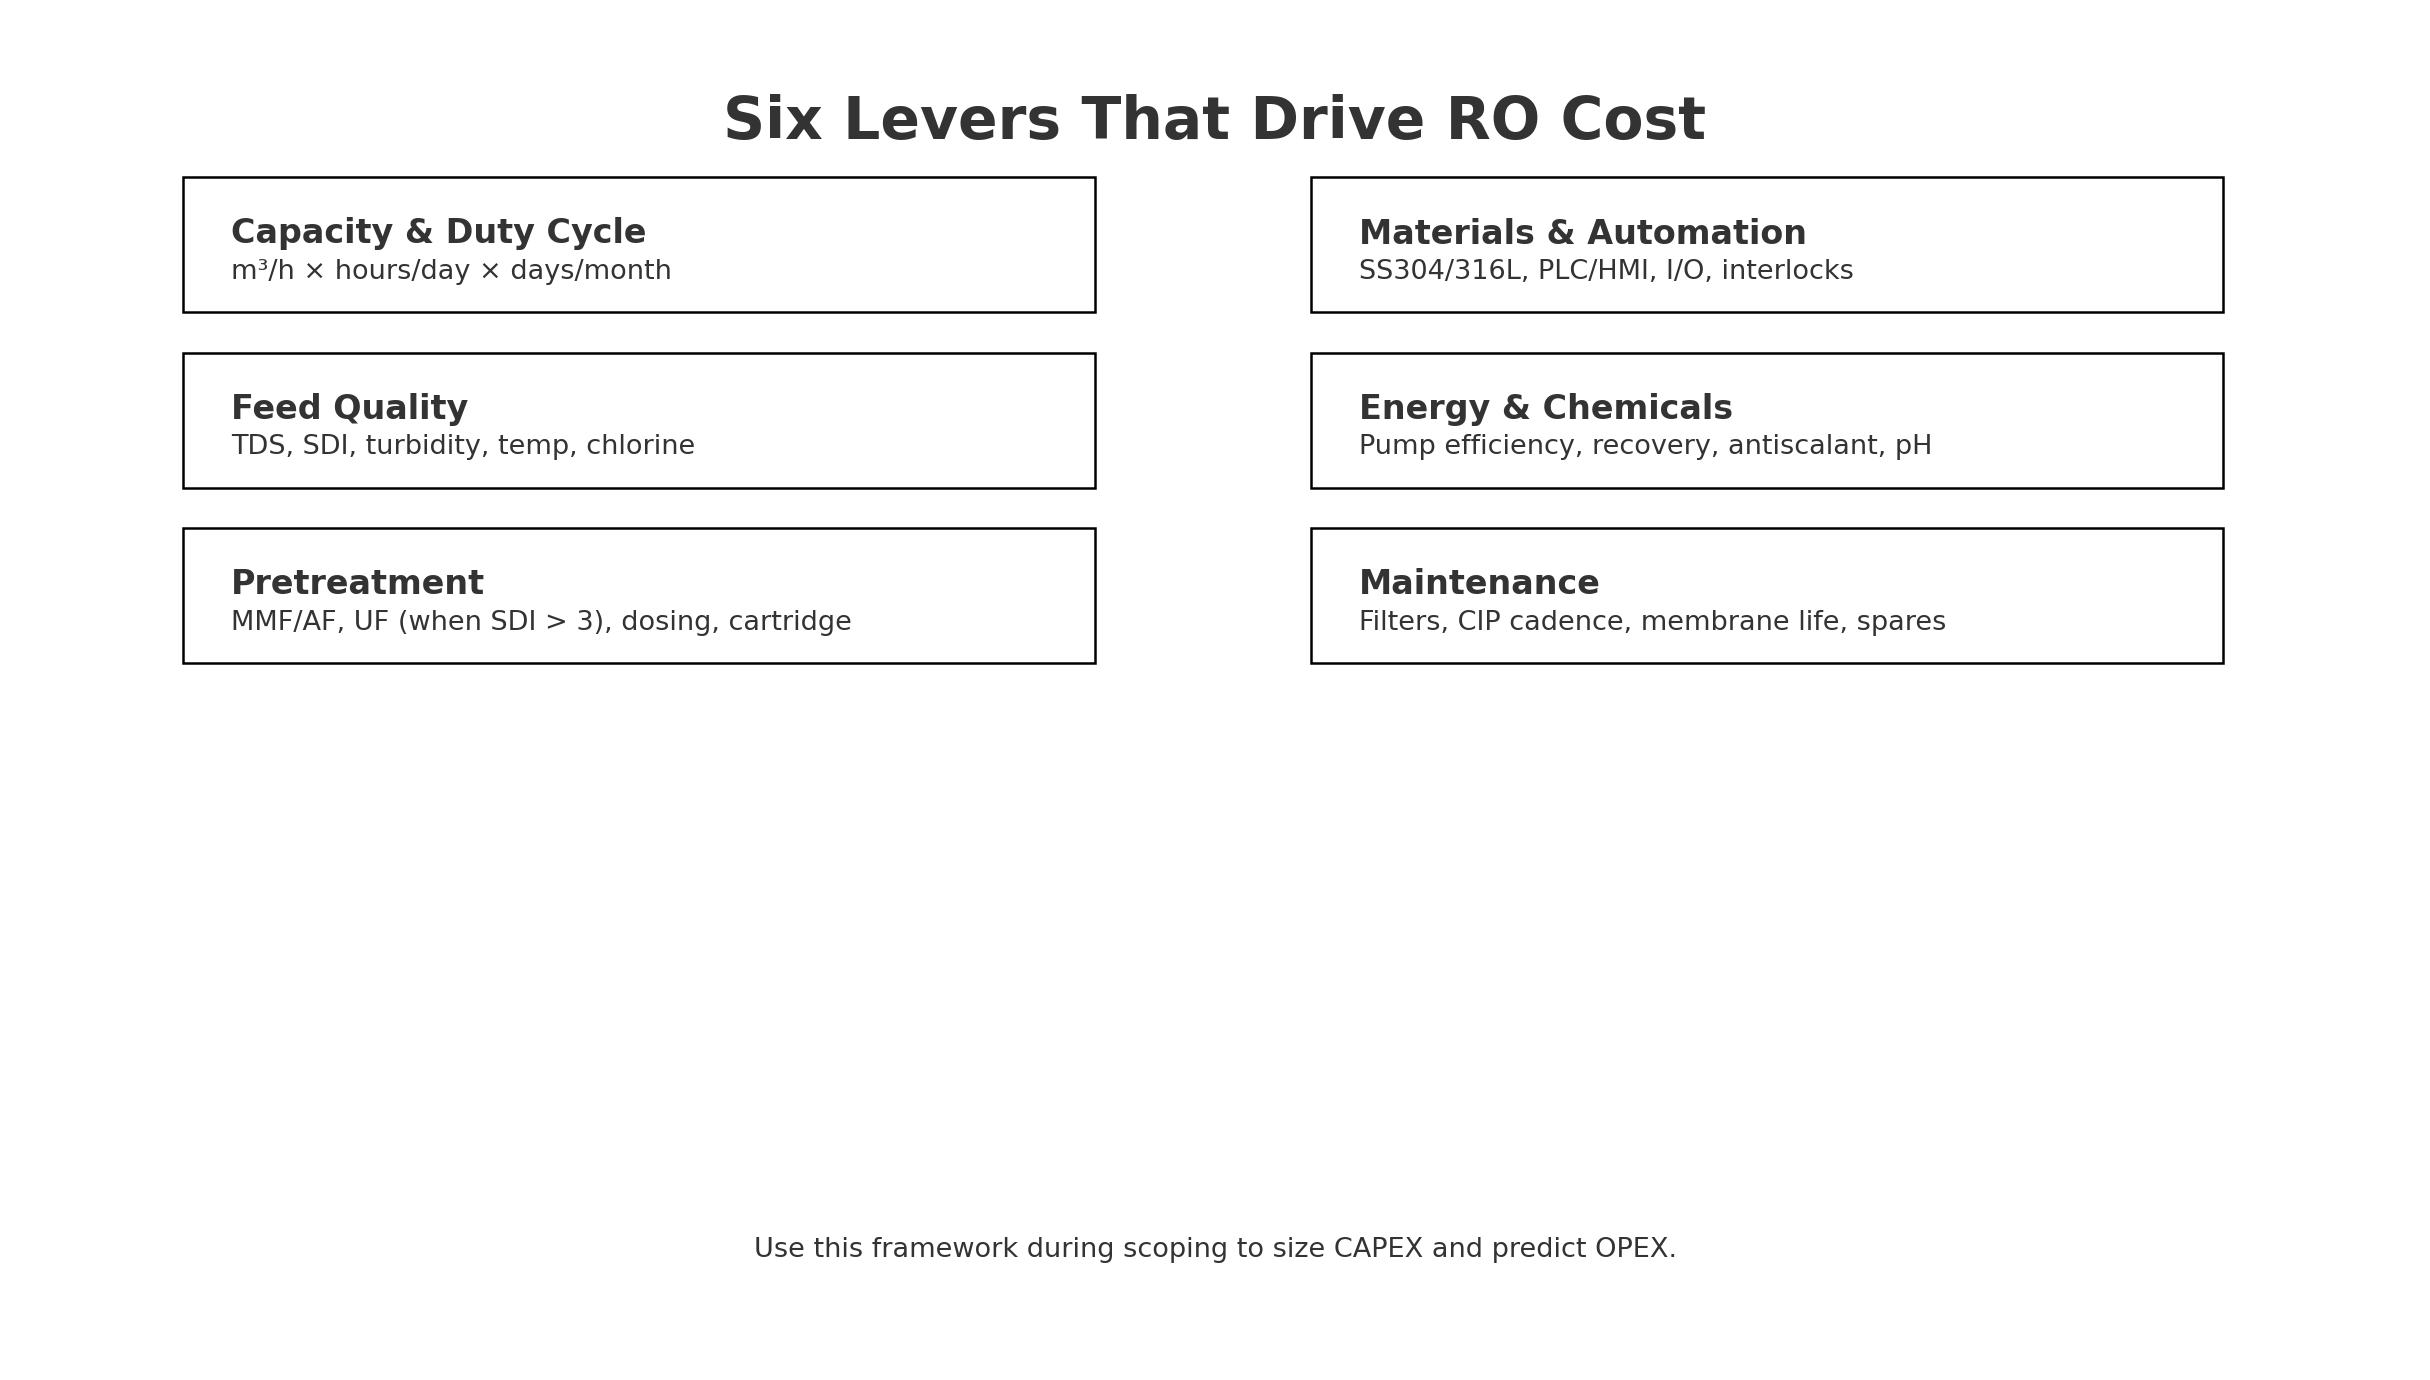
- Capacity & duty cycle — m³/h × hours/day × days/month sets pump size, energy, consumables and spares cadence.
- Feed quality — TDS, SDI, turbidity, free chlorine, Fe/Mn, temperature define pressure set-points, recovery and fouling risk.
- Pretreatment — MMF/AF, UF when SDI > 3, dechlorination, dosing, 5 μm cartridge; pretreatment quality determines membrane life and OPEX.
- Materials & automation - SS304 vs SS316L, hygienic expectations, PLC/HMI, I/O count, alarms, interlocks, remote links.
- Energy & chemicals — pump efficiency, recovery, antiscalant and pH control, cleaning agents.
- Maintenance — filter changeout, CIP frequency, membrane replacement interval, spares and labor.

For a complete reference design (architecture, KPIs, options), see 1000 LPH RO Water Treatment Solution: https://stark-water.com/solution/1000lph-ro-solution/.
2) CAPEX — where the upfront budget goes (1000 LPH brackish RO)
Pretreatment (to achieve SDI ≤ 3)
- MMF/AF to reduce turbidity, organics and chlorine, protecting the RO membrane surface.
- UF (optional but powerful) when SDI > 3 or turbidity is spiky/seasonal; stabilizes flux, lowers fouling rate.
- Patroon 5 μm as the final barrier; rated for dirt load and duty cycle.
These selections have the largest first-year impact on reverse osmosis plant cost.
RO skid (the core)
- Membranen: meestal 2 × 4040 polyamide for ~1 m³/h; final element selection depends on TDS, temperature and target conductivity.
- HP pump with VFD: high efficiency and correct sizing reduce lifetime energy spend.
- Instrumentatie: pressure, flow and conductivity online; analog/digital I/O into PLC/HMI with trend logging and interlocks.
- Onderdelen die met vloeistof in aanraking komen: SS304 standard; select SS316L for higher chloride exposure or sanitary environments.
Integration & documentation
- P&ID, GA/Layout, Electrical I/O list, O&M; clearly defined nozzles and footprint reduce site uncertainty and rework.
If you are already comparing BOMs or preparing an RFQ, the product entry point is here: https://stark-water.com/product/1000l-reverse-osmosis-system/.
3) OPEX — what you pay to run it (1000 LPH guidance)
Indicative ranges for brackish/borewell RO (site-dependent):
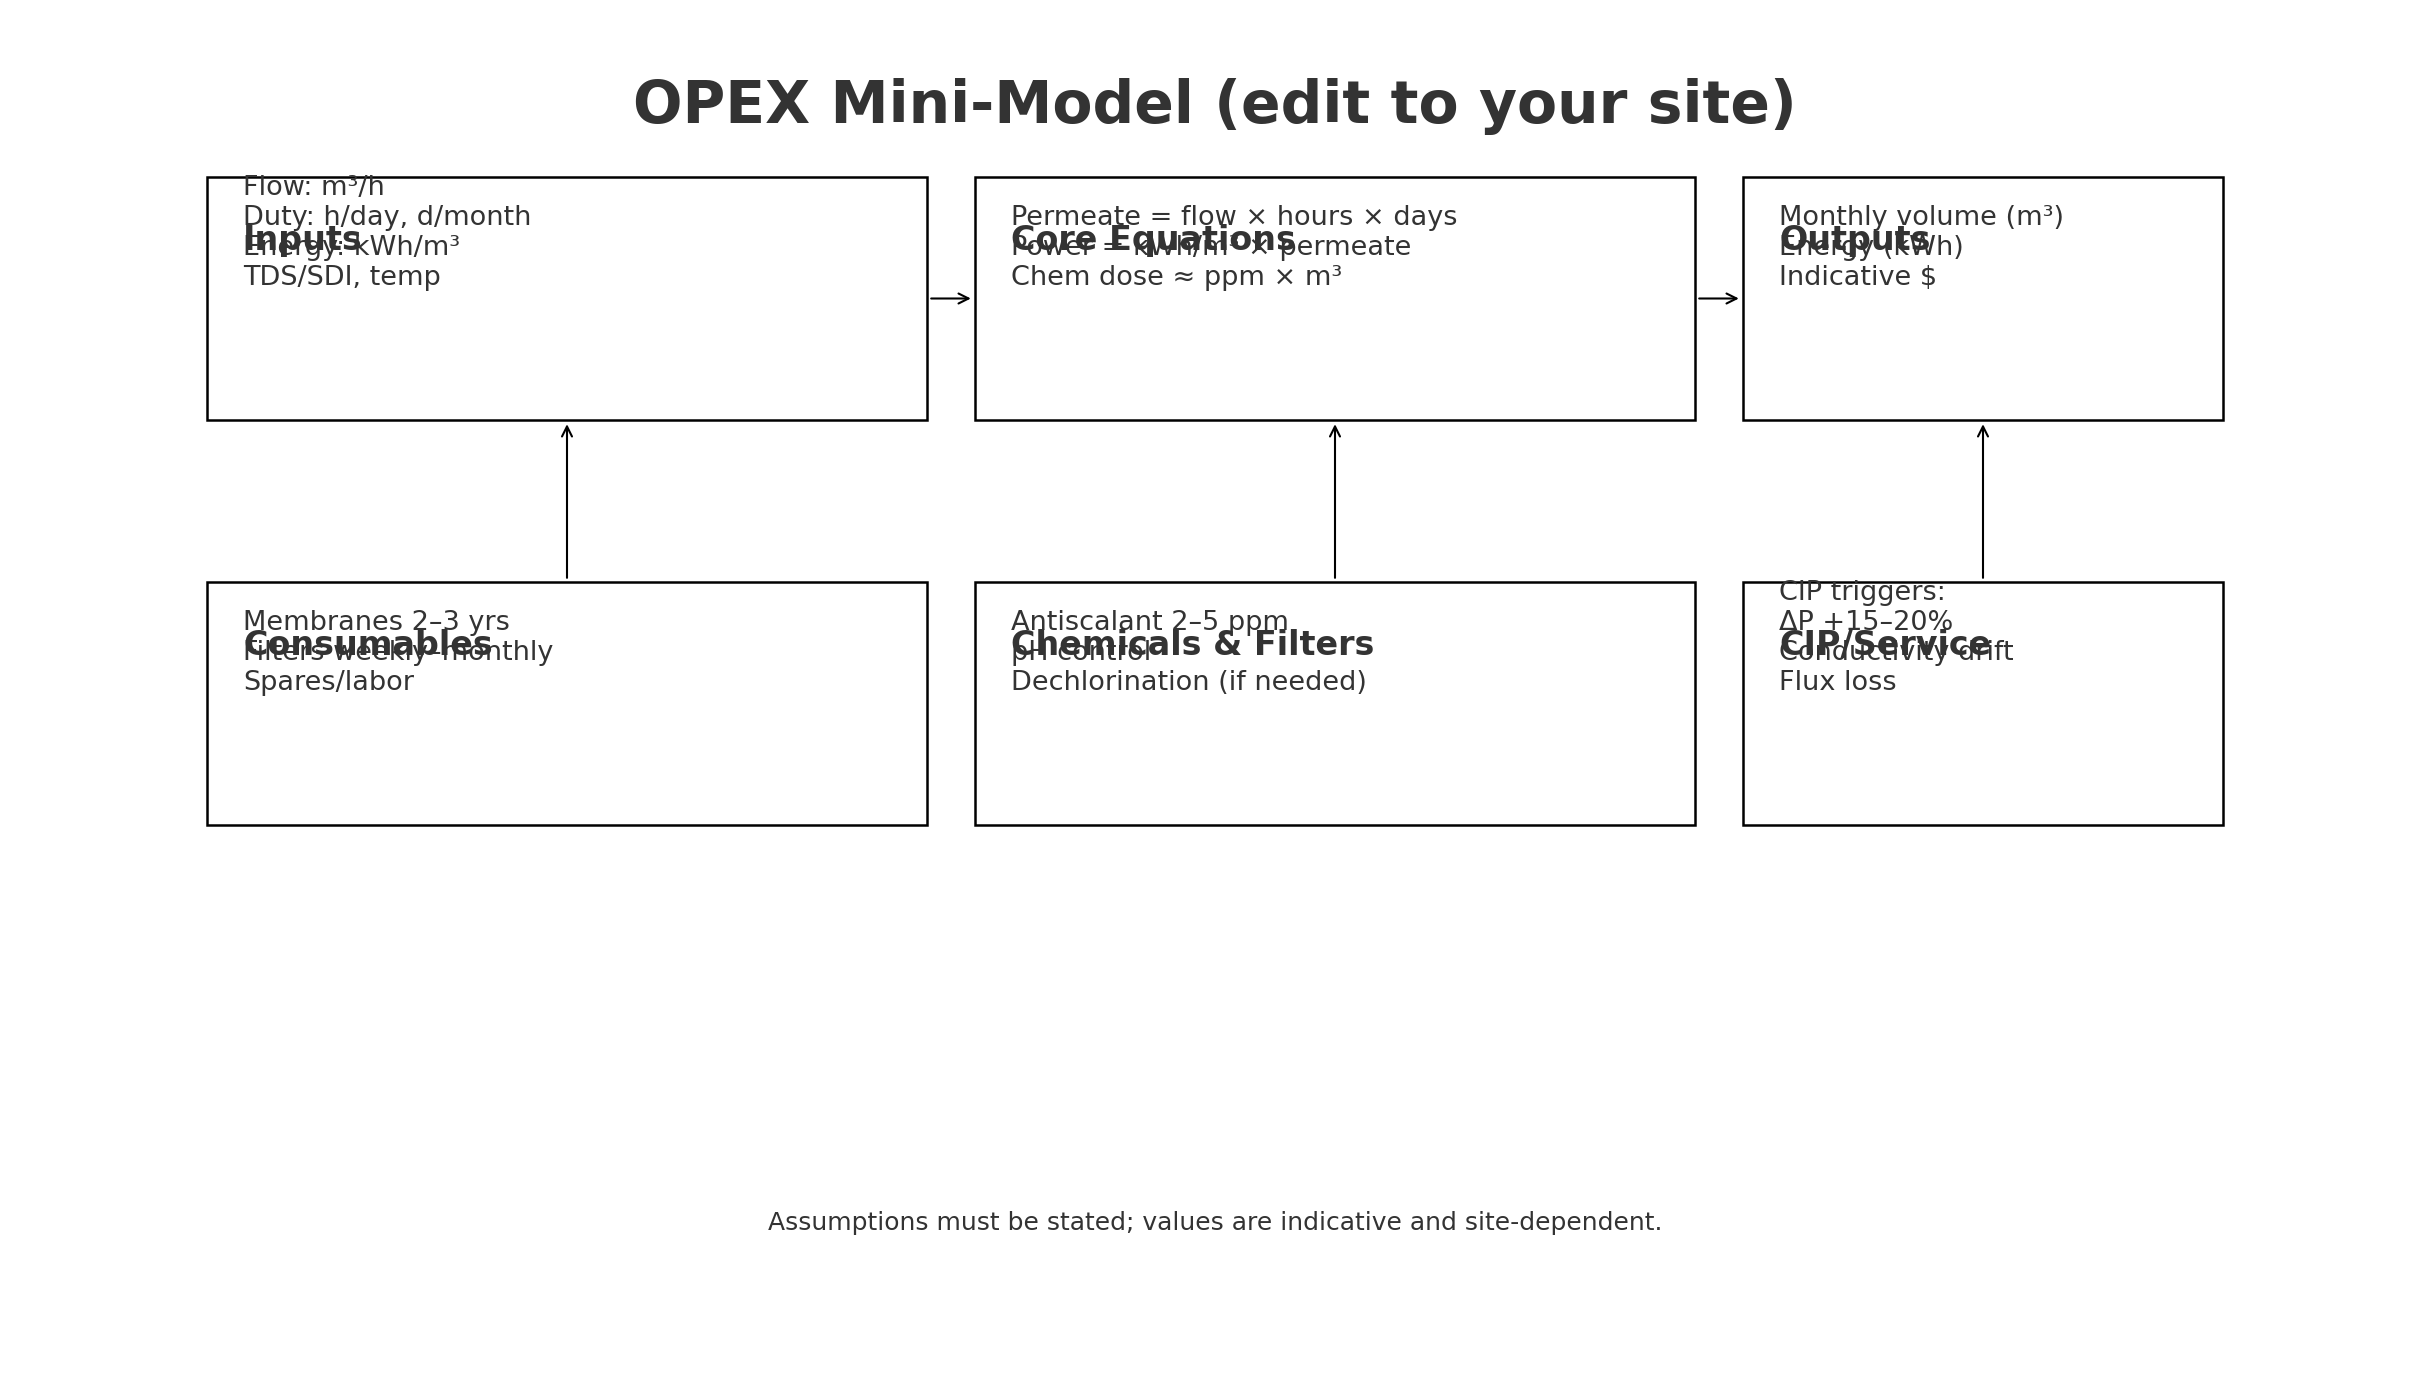
- Energy: ≈ 0.7–1.2 kWh/m³ at 8-16 bar.
- Chemicals: antiscalant ~ 2–5 ppm; acid/alkali for pH control and clean-in-place.
- Patroonfilters: weekly to monthly changeout depending on dirt load and pretreatment.
- Membranen: ~ 2–3 years with correct pretreatment and operation.
- CIP cadence: trigger on ΔP +15-20%, permeate conductivity drift, or normalized flux loss; many small plants see 3-6 maanden between CIPs.
Over time, operating set-points and chemical control dominate reverse osmosis plant cost.
For water-quality principles, see the
WHO-richtlijnen voor drinkwaterkwaliteit.

Mini OPEX model (edit to your site)
Assumptions: 1 m³/h, 10 h/day, 26 days/month, 1.0 kWh/m³
- Permeate volume: 260 m³/month
- Power: 260 kWh/month → at $0.12/kWh ≈ $31.2/month
- Antiscalant: 3 mg/L → 3 g/m³ × 260 ≈ 0.78 kg/month (apply local $/kg)
- Patroonfilters: ~ 4 pcs/month (weekly)
- CIP: 0.25 cycles/month if one CIP every four months (include chemicals, labor, downtime)
4) Recovery vs. energy vs. pretreatment (the key trade-off)
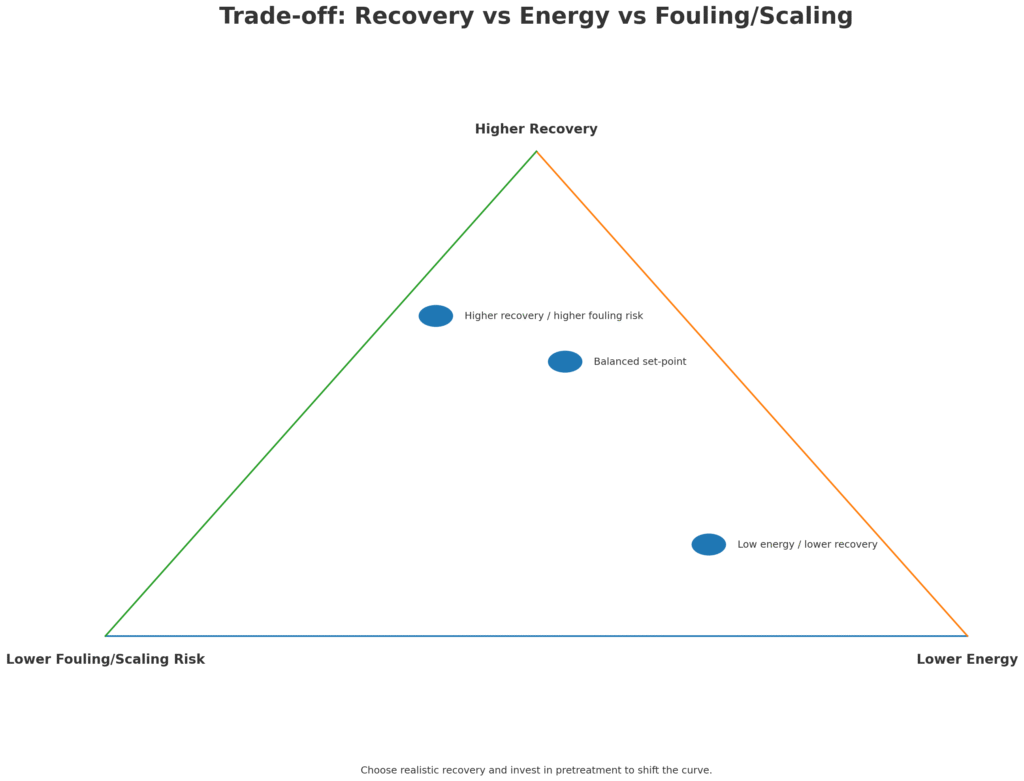
- Higher herstel raises scaling risk and can nudge energy up; managing this requires appropriate antiscalant/pH control and realistic set-points.
- Adding UF ahead of RO on marginal feeds (SDI slightly above 3) typically reduces cartridge consumption, extends membrane life and lengthens CIP intervals.
- Temperatuur impacts permeability; colder seasons require higher pressure to hold the same flux/quality—plan seasonal operating windows and energy budgets.
5) Lifecycle cost (LCC) & payback thinking
- A 0.2 kWh/m³ energy improvement through efficient pump/VFD and low-energy elements compounds with every operating hour.
- On unstable SDI feeds, skipping UF can double filter usage and shorten membrane life, pushing more frequent CIPs.
- Over a 2–3 year horizon, reduced cleanings, longer membrane life and less downtime commonly offset incremental pretreatment CAPEX.
When comparing vendors, normalize reverse osmosis plant cost by energy consumption and membrane replacement.
6) Sensible specs for a 1000 LPH brackish RO (cheat sheet)
- Permeate: < 100 μS/cm typical when feed TDS ≤ ~3000 ppm and pretreatment/dosing are correct
- Herstel: 55-70% (TDS, temperature and SDI dependent)
- Membranen: 2 × 4040
- Energy: ≈ 0.7–1.2 kWh/m³
- UF recommended when: SDI > 3, colloids/algae risk, or frequent turbidity spikes
7) Common mistakes to avoid
- Designing only for summer water quality; lower winter temperatures raise viscosity, pressure and energy.
- Treating SDI as optional; it is the primary fouling KPI before RO.
- Over-aggressive recovery targets that increase scaling, CIP frequency and chemistry consumption.
- Skipping conductivity trending; trend data provides early indication of membrane performance drift.
8) Buying checklist (copy/paste into your RFQ)
- Last 90 days of TDS/SDI readings
- Doel permeate conductivity (μS/cm) en recovery (%)
- UF pretreatment required? Final disinfection (UV/Ozone) required?
- Materials (SS304 / SS316L) and gasket specifications
- PLC/HMI requirements, I/O list, communications (Modbus/TCP, OPC)
- GA/Layout constraints: footprint, nozzles, utilities
- Local energy and chemical prices; O&M staffing plan

9) FAQ (short)
What energy should I plan for?
For brackish RO, plan ≈ 0.7–1.2 kWh/m³ at 8-16 bar, adjusted for salinity, temperature and recovery.
Heb ik een UF-voorbehandeling nodig?
When SDI > 3 or turbidity is variable, UF stabilizes flux and reduces fouling, typically extending membrane life and reducing CIP frequency.
Hoe vaak is CIP vereist?
Trigger on ΔP +15-20%, permeate conductivity drift or normalized flux loss. With good pretreatment, many small plants see 3-6 maanden between CIPs.

