


Why this guide? If you search for RO membrane unit conversion during design or maintenance, you need fast tables you can trust, practical conductivity tips (normalized to 25 °C), and clear installation/removal steps that prevent seal mistakes and early performance loss.
ASTM water conductivity methods
NIST conductivity temperature compensation
Reviewed by Stark Water Process Engineering Team • Last updated: 2025-11-03 • Reading time: 9–12 min
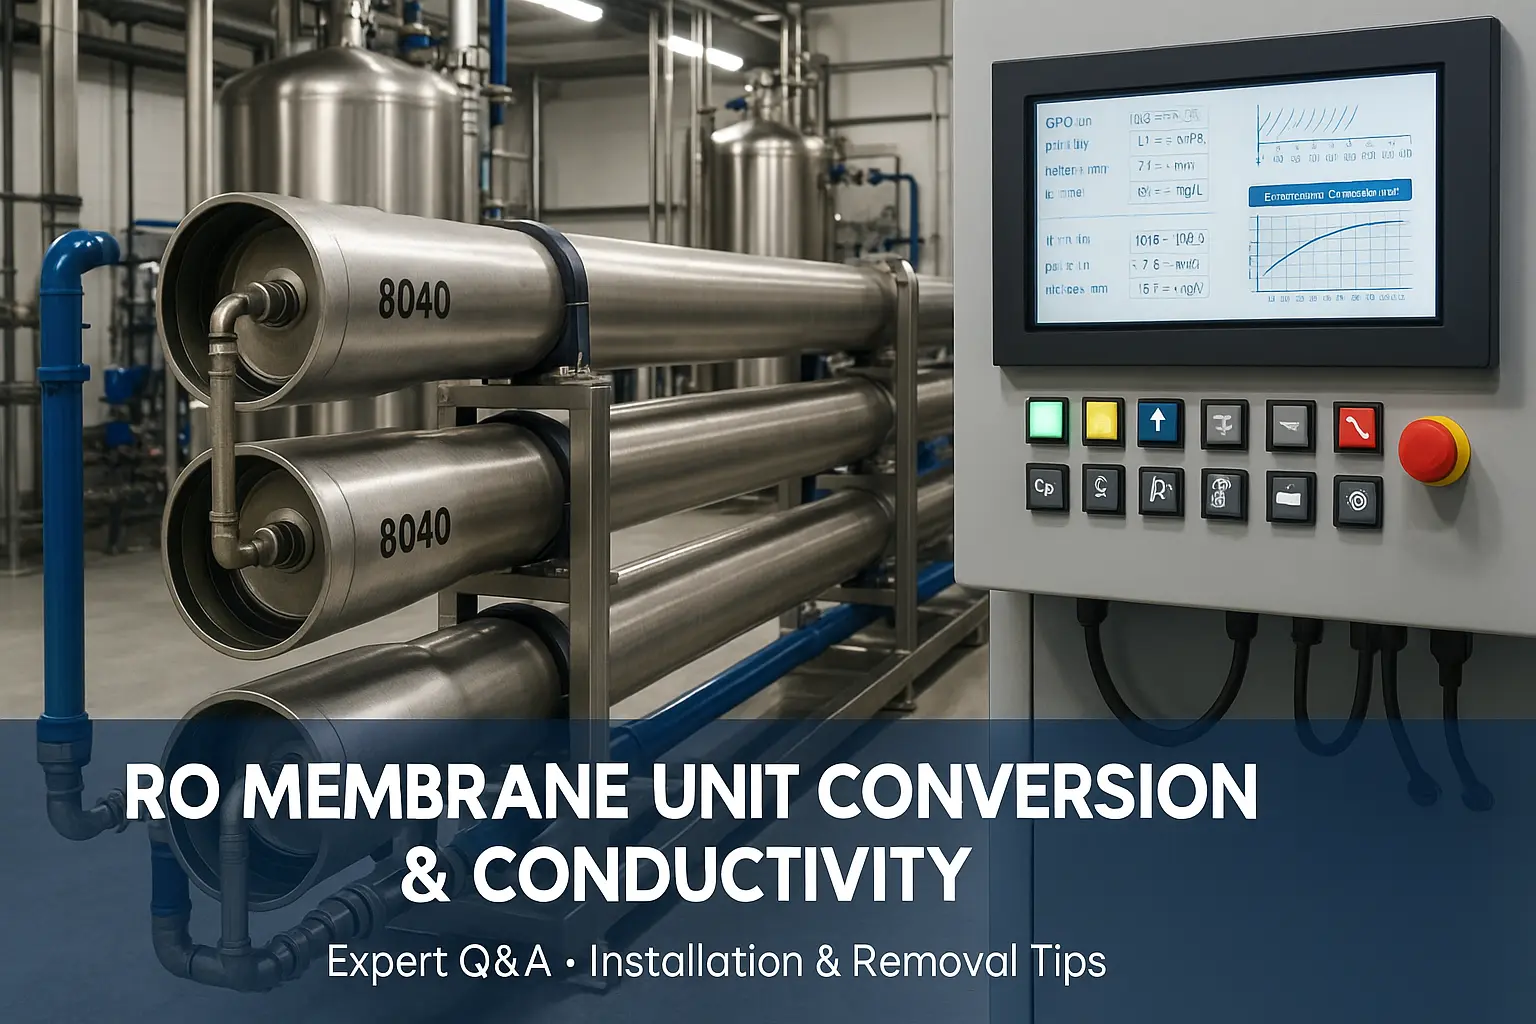
RO membrane unit conversion tables (engineer’s cheat-sheet)

Common element sizes
| Code | Nominal OD | Length | Typical area (ft² / m²) |
|---|---|---|---|
| 2540 | 2.5 in ≈ 63.5 mm | 40 in ≈ 1,016 mm | 28–40 ft² (2.6–3.7 m²) |
| 4040 | 4.0 in ≈ 101.6 mm | 40 in ≈ 1,016 mm | 70–90 ft² (6.5–8.4 m²) |
| 8040 | 8.0 in ≈ 203.2 mm | 40 in ≈ 1,016 mm | 365–440 ft² (33.9–40.9 m²) |
Use this RO membrane unit conversion table to switch GPD↔L/h fast.
Length & area
| Length | Conversion | Area | Conversion |
|---|---|---|---|
| in → mm | × 25.4 | in² → cm² | × 6.4516 |
| mm → in | ÷ 25.4 | ft² → m² | × 0.092903 |
| ft → m | × 0.3048 | m² → ft² | × 10.7639 |
Durchfluss
| From | To | Factor | Example |
|---|---|---|---|
| GPD | L/day | × 3.785 | 10,000 GPD → 37,850 L/d |
| GPD | L/h | × 0.1577 | 10,000 GPD → 1,577 L/h |
| m³/h | GPM (US) | × 4.402 | 2.5 m³/h → 11.0 GPM |
For pumps/instruments, this RO membrane unit conversion sheet avoids mix-ups.
Druck
| From | To | Factor | Typical RO usage |
|---|---|---|---|
| psi | bar | × 0.0689476 | 600 psi ≈ 41.4 bar (brackish) |
| bar | MPa | × 0.1 | 41.4 bar ≈ 4.14 MPa |
| kPa | psi | × 0.145038 | 690 kPa ≈ 100 psi |
Concentration & chlorine shorthand
| Artikel | Rule | Example |
|---|---|---|
| ppm vs mg/L | In dilute water, 1 ppm ≈ 1 mg/L | Free Cl ≤ 0.05 mg/L at RO feed |
| TDS (mg/L) | ≈ Conductivity (µS/cm) × 0.5–0.8 (water-specific) | 500 µS/cm → ~300–400 mg/L |
Temperature: K, °C and °F conversion
| Relationship | Formula | Example |
|---|---|---|
| °F → °C | (°F − 32) × 5/9 | 77 °F → 25 °C |
| °C → °F | (°C × 9/5) + 32 | 25 °C → 77 °F |
| °C → K | °C + 273.15 | 25 °C → 298.15 K |
Conductivity: calibration & 25 °C compensation
Always compare conductivity at the same temperature. The industry norm is 25 °C. A simple engineering estimate for compensation is a linear 2 %/°C:
Faustformel (10–40 °C): σ25 ≈ σT ÷ [1 + 0.02 × (T − 25)]
- Reference solutions: Calibrate with known KCl standards (e.g., 0.01 M and 0.02 M) and verify against a table at the bath temperature.
- Cell constant: If unknown, back-calculate using a standard. Re-verify monthly in industrial service.
- Process tip: Normalize permeate conductivity to 25 °C before trending salt passage.

How to install RO membranes (feed-to-concentrate, brine seal facing feed)
This procedure minimizes seal damage and start-up issues. Read OEM manuals first and comply with site LOTO.
- Isolate, depressurize and lock/tag out. Remove vessel endplate at the concentrate end.
- Rinse vessel; lightly glycerin-wipe interior if allowed.
- Insert the first element from the feed end with the brine-seal lip facing the feed side.
- Join elements with approved couplers; lubricate O-rings as allowed; keep couplers fully seated.
- Install thrust ring at concentrate end; fit adapter and O-rings; re-install endplate/clip per OEM torque.
- Push the stack toward concentrate to remove slack; shim to prevent axial movement; reconnect piping.
- Leak check with low pressure water; verify ΔP is normal before full-pressure operation.
How to remove RO membranes (safe extraction & labeling)
- Isolate, depressurize, drain and LOTO. Remove external lines and the concentrate endplate.
- Push from the feed end to extract elements one by one—catch and bag each element.
- Tag element order and orientation; protect seals; record serials and vessel IDs for traceability.
- Inspect O-rings, couplers, brine seals and endcaps; replace damaged parts before reassembly.
Acceptance checks after installation/removal
- Mechanisch: correct element count and order, brine-seal orientation, endplate clips/torque, no axial play.
- Hydraulic: baseline ΔP, permeate flow and salt passage vs. datasheet (normalized to 25 °C).
- Records: vessel/element tags, photos, torque data, and sign-off.
FAQ — quick answers that rank
How do I convert GPD to L/h for an 8040 train?
Multiply by 0.1577. Example: 10,000 GPD ≈ 1,577 L/h.
What’s 600 psi in bar and MPa?
600 psi ≈ 41.4 bar ≈ 4.14 MPa.
Which way does the brine seal face?
Toward the feed end. The lip faces incoming feed to prevent bypass.
Why convert conductivity to 25 °C?
Conductivity rises about 2 % per °C. Normalizing to 25 °C ensures trends reflect salt passage, not temperature swings.
What if my conductivity cell constant is unknown?
Calibrate with KCl standards (e.g., 0.01 M/0.02 M), calculate the constant, and re-verify monthly.
Nächste Schritte (RFQ & interne Links)
Share your RO design case—our team will review sizing, verify interstage hydraulics and propose the right stainless-steel housings.
Editorial standards (EEAT): Content prepared by Stark Water process engineers and quality-checked by senior staff with 10+ years in industrial RO. Procedures must be validated against your OEM manuals and site safety rules.