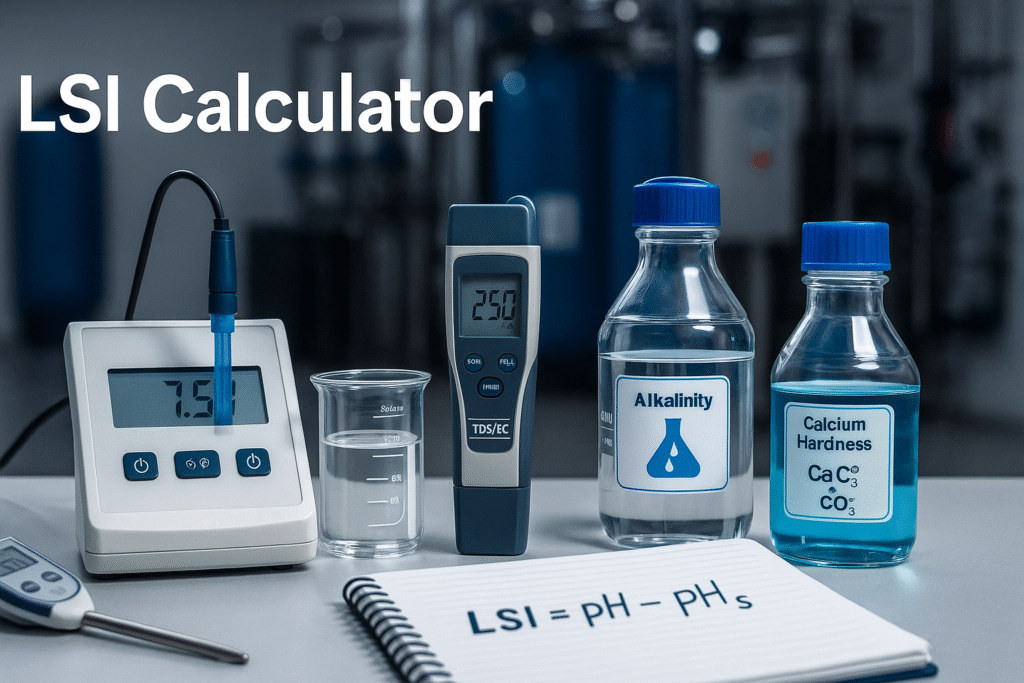
LSI Calculator
What this LSI calculator does
This free LSI calculator computes the Langelier Saturation Index using five inputs: pH, temperature, TDS (or conductivity converted to TDS), calcium hardness (as CaCO₃) and alkalinity (as CaCO₃). The result helps you quickly judge whether water is likely to be scale forming, balanced or corrosive, so you can set practical targets for pretreatment, antiscalant dosing, or post-treatment stabilization.
When to use it
- RO feedwater screening — estimate scale tendency before membrane design and antiscalant selection.
- Cooling water — monitor whether cycles of concentration push LSI into heavy scaling territory.
- Process & potable stabilization — check if finished water after RO needs alkalinity remineralization.
Inputs explained
- pH — field-measured or online value at operating temperature.
- Temperature — °C; LSI is temperature sensitive (warmer water usually raises scaling risk).
- TDS — mg/L. If you only have conductivity, apply your site factor (e.g., TDS ≈ 0.5–0.7 × μS/cm) and verify with lab data.
- Calcium hardness — as CaCO₃ (mg/L); do not use total hardness if Mg is significant.
- Alkalinity — as CaCO₃ (mg/L); primarily bicarbonate/carbonate alkalinity.
How LSI is calculated (concept)
LSI is defined as LSI = pH − pHs, where pHs is the saturation pH at which water is in equilibrium with calcium carbonate. A common engineering form is:
pHs = (9.3 + A + B) − (C + D), where terms A–D are functions of TDS, temperature, calcium hardness and alkalinity.
Different handbooks use slightly different constants, but the interpretation below remains consistent.
How to interpret LSI
- LSI > +0.5 — strongly scaling: expect CaCO₃ precipitation without control.
- +0.2 … +0.5 — mildly scaling / protective tendency.
- −0.2 … +0.2 — near balanced; fine-tune with real-time data.
- −0.5 … −0.2 — mildly corrosive; check alkalinity and buffering.
- < −0.5 — corrosive tendency; consider stabilization (e.g., caustic, remineralization) and materials selection.
Worked example (illustrative)
At 25 °C with pH = 7.6, TDS = 1,000 mg/L, Ca hardness = 120 mg/L as CaCO₃, alkalinity = 80 mg/L as CaCO₃, the calculator gives LSI ≈ −0.3 (slightly corrosive). Options include raising alkalinity, slightly increasing pH set-point, or blending with a more mineralized stream to move toward LSI ≈ 0.
Good practice & caveats
- Temperature-correct your inputs; mixing hot and cold samples skews results.
- At very low TDS (<~100 mg/L) or very high TDS (>~10,000 mg/L), LSI becomes less predictive. In those regimes, consult additional indices (e.g., RSI, CCPP) and pilot data.
- RO permeate often has very low alkalinity and poor buffering; tiny pH changes move LSI a lot — trend online pH and add stabilization if needed.
- Use LSI with antiscalant design tables and actual membrane limits; LSI is an indicator, not a guarantee.
Related reading
Background on the index is summarized here: Langelier Saturation Index (Wikipedia). For RO pretreatment and cost modeling, try our RO OPEX Calculator and the 1000 LPH RO Water Treatment Solution.
From calculator to action
If LSI shows scaling risk at your operating temperature, options include lower recovery, antiscalant dosing, pH set-point adjustment or upstream softening. If LSI shows corrosive tendency in finished water, consider remineralization (alkalinity, hardness) and materials compatibility in downstream piping.
FAQ
What inputs do I need for the LSI calculator?
pH, temperature (°C), TDS (mg/L), calcium hardness as CaCO₃ (mg/L) and alkalinity as CaCO₃ (mg/L). Use temperature-corrected values from the same sample.
How do I interpret the LSI result?
LSI > +0.5 indicates scaling tendency; −0.5 to −0.2 indicates corrosive tendency; −0.2 to +0.2 is close to balanced. Use trend data and onsite testing to confirm.
Is LSI reliable for RO permeate?
It’s indicative but less stable because permeate has low alkalinity and poor buffering. Small pH drifts can swing LSI. Stabilize permeate if needed.
What should I do if LSI is strongly positive?
Reduce scaling risk via antiscalant, lower recovery, pH control or softening. Confirm with vendor limits and pilot data.
